towardsdatascience.com
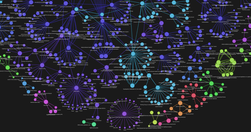
Combines a good primer on Knowledge Graphs with a detailed technical explanation of how to "convert any text corpus into a Knowledge Graph using Mistral 7B", although he prefers to refer to them as "Graph of Concepts".Interestingly, "this project can be run easily on a personal machine... to convert any text corpus into a …
mathewlowry.myhub.ai
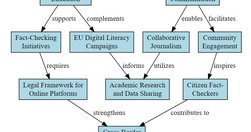
"If Charts lie, ChatGPT visualisations lie brilliantly". Exploring knowledge visualisations powered by ChatGPT, which can be particularly problematic because of the way the LLM's hallucinations - already hard to spot by their very nature - are also hidden behind the visualisation. But they have real potential as a creative muse.
www.sarman.work
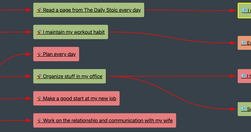
David's "journey trying to visualise relationships in my Obsidian notes" passed via various approaches, including d3, as he tried to create diagrams encapsulating relationships between nodes.He then stumbled upon the obsidian-excalidraw-plugin ... [which] automatically generate Excalidraw diagrams with its Excalidraw Automate featur…
mathewlowry.myhub.ai
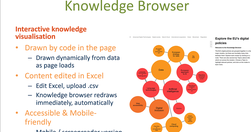
An interactive knowledge visualisation providing a graphical overview of interrelated online concepts, edited dynamically with an Excel file. Featuring an accessible version driven by the same content.
usefulcharts.com
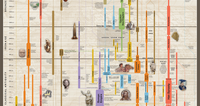
To everyone who's ever asked "what's that poster to your left of your desk?", I bring you UsefulCharts' Timeline of World History, which came embedded in their eponymous book, received last Christmas."covering 3300 BCE - present... displays all the major empires, kingdoms, and civilizations throughout history in a sid…