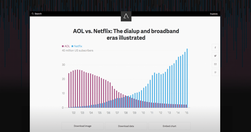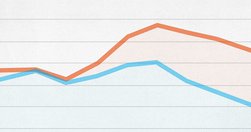
Our interactive graphic offers a real-time snapshot of the race, using media attention to track the fortunes of the presidential hopefuls... explore the graphic and view a running picture of how the candidates are faring on television during the election season, or drill into the numbers by network using the explorer dashboard. - Media Cover…

Atlas deepens our journalism by offering readers better access to the data and visualizations in so many of our stories. It also extends the reach of our journalism by letting you make use of our charts in new ways ... as we build out the platform, we are hoping to let anyone make charts in Atlas... Atlas gives each of our charts its own home, …

Visualise your data and embed interactive, annotated graphs in your stories for free... At Journalism.co.uk we've been regularly using Datawrapper, Infogram and Google Sheets to name a few, and we have highlighted many others in our pieces. Plotly is perhaps one of the more complex resources, but it's free to use and enables its users to cre…

"A new interactive documentary, “The Fallen of World War II,” ... 18-minute film is styled like an infographic and that helps viewers fathom the scale of casualties in a way that simple numbers cannot.... The base elements it uses are simple human-shaped icons. Each of those represents one thousand deaths – and at some points in the video they …

'add a bit of punch' to stories using data visualisation - Data visualisation tips from Information is Beautiful | Media news

Good analyses of where data visualisation is heading: "Today, a slew of new software has made it easier than ever to create data visualizations from scratch. The downside? It has led to more prescriptive design. Take D3. It's a JavaScript library that helps turn information into any number of visual frameworks...Beyond D3... Tableau is the crow…
The Journalist's Toolbox

"Newsrooms don't need large budgets for analyzing data--they can easily access basic data tools that are free or inexpensive." - Drilling Down: A Quick Guide to Free and Inexpensive Data Tools | Global Investigative Journalism Network

"Charted automatically visualizes data. Give it the link to a data file and Charted returns a beautiful, shareable visualization of that data... open-sourced and available for anyone to use at charted.co... it adjusts to any screen, automatically updates itself" - Introducing Charted - Data Lab - Medium

"Swarmize enables journalists to tell new, collaborative stories by making use of real-time data collection and visualisation" Just the tests they've already done are awesome. The code's on GitHub. Think to use in surveys, real-time social media monitoring, live blogs ... anything where real-time is useful and/or you might want a second bite at t…
Tracking #Ferguson on Twitter. Via @Mathewi, GigaOm

The first – and possibly still the only – site on EUROPA to tap popular support (via sheer user traffic) for a new EU regulation.