Visualising complexity
Imported from the Blogactiv.eu blogging platform, closed without warning in 2021. Links, images and embeds not guaranteed, and comments not displayed.
I started out as a science journalist before moving to Europe, so I've always loved explaining complex things. Unfortunately, although I love words, they're often not enough - nothing beats an infographic, or better a narrated animation, to really get complex things across.
Unfortunately, I'm a rubbish artist, so until recently all I could do was either work with graphic artists, or do clunky powerpoint shows with too many animations and then add my awful voice to make a screencast. Today, however, tools to capture and/or present knowledge graphically are becoming increasingly powerful and within-reach to design-challenged writers like me.
Just in the past week, for example, I came across:
Prezi: words cannot do justice to Prezi, which is the point. Revolutionary, revelationary and liberating:
[kml_flashembed movie="http://www.youtube.com/v/72W7o_InZCU" width="425" height="350" wmode="transparent" /]
Debategraph: an FIR podcast introduced me to Debategraph, a collaborative, wiki-like tool for portraying a debate and aims to "make the best arguments on all sides of any public debate freely available to all and continuously open to challenge and improvement by all.". It is being used by The Independent newspaper to discuss the future of newspapers. I'd love to embed it here but Wordpress won't let me.
Google's wonder wheel: a LinkedIn group led me to a video on problogger explaining a Google search engine feature I'd never looked at before - the Wonderwheel, which presents your search term in the centre of a sort of mind map, presenting useful search refinements as branches. The video is aimed at bloggers facing writer's block, so I thought I'd also embed a much shorter video from the Google engineer behind it:
[kml_flashembed movie="http://www.youtube.com/v/_Ah7ZWYjxdM" width="425" height="350" wmode="transparent" /]
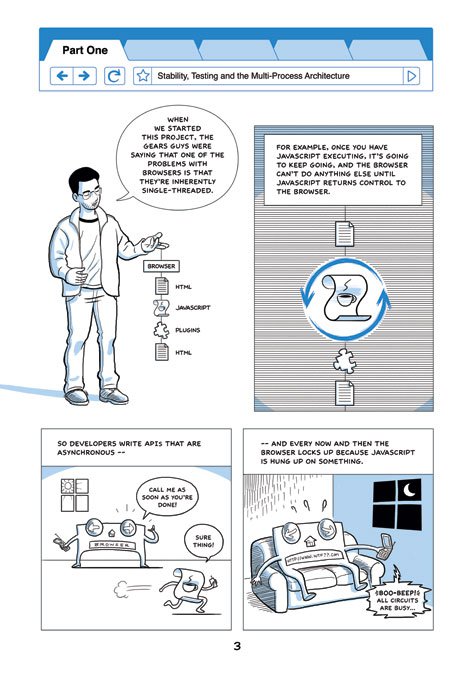
Bitstrips: Also this week, an RWW article on my Reader led me to Bitstrips, a wonderful tool for building comic strips. It was developed for teachers but the potential for using comic strips is enormous, as Google's comic strip to launch Chrome showed:
OK, so that one didn't come across my desk last week, and neither did this video my friend Pras did at Group Partners a whole back. Still, it rocks, and shows that you don't need anything cleverly digital to work graphically:
[kml_flashembed movie="http://www.youtube.com/v/d_g1dXYWK34" width="425" height="350" wmode="transparent" /]
In fact, all you really need is the back of a napkin to win slideshare's 'best presentation of 2009' (and explain what healthcare reform is all about):
[slideshare id=1867808&doc=healthcarenapkinall-090816001957-phpapp01]
And that one did come across my desk last week. Other stuff I've tagged 'visualisation' recently includes, in no particular order:
- a wonderful collection of infographics by Francesco Mugnai
- Lovely charts online diagram software
- the mind the gap interactive presentation of world (in)equality and related subjects
- Wordle, which I used on Barroso's speech
- bestiario.org researchers
I can't help thinking that tools and techniques like this could do a lot better job than the acres of online text and desperately unviral YouTube videos that keep being used to try and explain the EU.
Related reading
More Stuff I Think
More Stuff tagged visual , tools
See also: Content Strategy