Overview: Science&Technology
Relevant resources
mathewlowry.myhub.ai
"If Charts lie, ChatGPT visualisations lie brilliantly". Exploring knowledge visualisations powered by ChatGPT, which can be particularly problematic because of the way the LLM's hallucinations - already hard to spot by their very nature - are also hidden behind the visualisation. But they have real potential as a creative muse.
medium.com
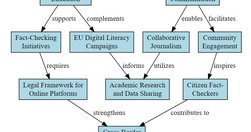
"Gantt Chart, Organization, Timelines, Entity Relationship, and Mind Maps Diagram all in less than 1 minute... instruct ChatGPT to come out with the required syntax to generate your diagram ... Generate a <diagram type> in mermaid.js syntax with the following details: <details of the diagram> "
www.wired.com
"In this gallery are our favorite graphics of the year. " The Best Science Visualizations of the Year | WIRED
medium.com

"Charted automatically visualizes data. Give it the link to a data file and Charted returns a beautiful, shareable visualization of that data... open-sourced and available for anyone to use at charted.co... it adjusts to any screen, automatically updates itself" - Introducing Charted - Data Lab - Medium
sunlightfoundation.com

"The parliamentary process is indeed so similar to a collaborative software development workflow that it is only natural to try and use a version control tool such as Git to track individual legislative changes." - OpenGov Voices: How GitLaw turns the French parliamentary process into open data - Sunlight Foundation Blog