"Charted automatically visualizes data. Give it the link to a data file and Charted returns a beautiful, shareable visualization of that data... open-sourced and available for anyone to use at charted.co... it adjusts to any screen, automatically updates itself" - Introducing Charted - Data Lab - Medium

Consider this your starting point to tap into Google’s suite of digital tools that can enhance newsgathering and exposure across television, radio, print and online. Whether it’s refining your advanced search capabilities, improving audience engagement through Google+, or learning how to visualize data using Google Maps, this website is intended …

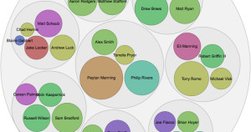
"The way it works is pretty simple: You paste data from a table (this can be a spreadsheet or even a web page), choose from a handful of visualization types (Raw explains what each one is best for) and then drag the variables you want to analyze into the predefined mapping categories (as you can see below, it’s really self-explanatory). Then you d…