or
or
or
&
&
How to (Cleverly) Distort a Visualization to Support Your Biased Narrative
medium.com
Card image

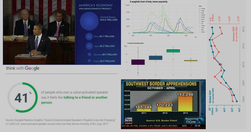
eight charts that demonstrate the ability to bias the data towards your narrative... Tweaking the y-axis zero base line and the scale is the equivalent of changing the data itself

Cookies disclaimer

MyHub.ai saves very few cookies onto your device: we need some to monitor site traffic using Google Analytics, while another protects you from a cross-site request forgeries. Nevertheless, you can disable the usage of cookies by changing the settings of your browser. By browsing our website without changing the browser settings, you grant us permission to store that information on your device. More details in our Privacy Policy.